Building a chatbot – that actually works

In the era of artificial intelligence and machine learning, chatbots have gained a lot of attention. Chatbots can for example help a user to book restaurants or schedule flights. But why should organizations use chatbots instead of simple user interaction (UI) systems? Considering that chatbots are both easier and more natural to interact with -compared to that of a UI system – endorses the implementation of chatbots in certain use cases. Additionally, a chatbot can engage a user for a longer time which can result in a company increasing its business. A chatbot needs to understand the natural language as there can be multiple ways to express one’s intention with language ambiguity. Natural Language Processing (NLP) helps us to achieve this to some extent.

Natural language processing – the foundation for a chatbot

Compared to rule-based solutions, chatbots using machine learning and language understanding are much more efficient. After years and new waves of statistical models, such as deep learning RNN, LSTM, transformers etc., these algorithms have now become market standards.

NLP is a part of linguistics and artificial intelligence, where algorithms are used to understand, analyze, manipulate and potentially generate human readable text. Usually, it contains two components: Natural Language Understanding (NLU) and Natural Language Generation (NLG).

To start with, the natural language input is mapped into useful representation for machine reading comprehension. This is achieved through using basics like: tokenization, stemming / lemmatization or tagging part of speech. There are also more advanced elements such as recognizing named entities or chunking. The latter is a processing method which organizes the individual terms found previously into a more prominent structure. For example: ’South Africa’ – is more useful as a chunk than the individual words ‘South’ and ‘Africa’.

FIGURE 1: A PROCESS OF BREAKING A USER’S MESSAGE INTO TOKENS

FIGURE 1: A PROCESS OF BREAKING A USER’S MESSAGE INTO TOKENS

From the other side, NLG is the process of producing meaningful phrases and sentences in natural language from an internal structural representation using e.g. content determination, discourse planning, sentence aggregation, lexicalization, referring expression generation or linguistic realization.

Open-domain and Goal-Driven Chatbot

Chatbots can be classified into two categories: Goal-driven and Open-domain. Goal-driven chatbots are built to solve specific problems such as a flight bookings or restaurant reservations. On the other hand, the Open-domain dialogue system attempts to establish a long-term connection with the user, such as psychological support and language learning.

Goal-driven chatbots are based on slot filling and handcrafted rules, which are reliable but restrictive in conversation. A user has to go through a predefined dialogue flow to accomplish a task.

FIGURE 2: ARCHITECTURE FOR GOAL-DRIVEN CHATBOT

FIGURE 2: ARCHITECTURE FOR GOAL-DRIVEN CHATBOT

Open domain chatbots are intended to converse coherently and engagingly with humans and maintain a long dialog flow with a user. However, we need to have big amounts of data to train these chatbots.

FIGURE 3: ARCHITECTURE FOR OPEN-DOMAIN CHATBOT

FIGURE 3: ARCHITECTURE FOR OPEN-DOMAIN CHATBOT

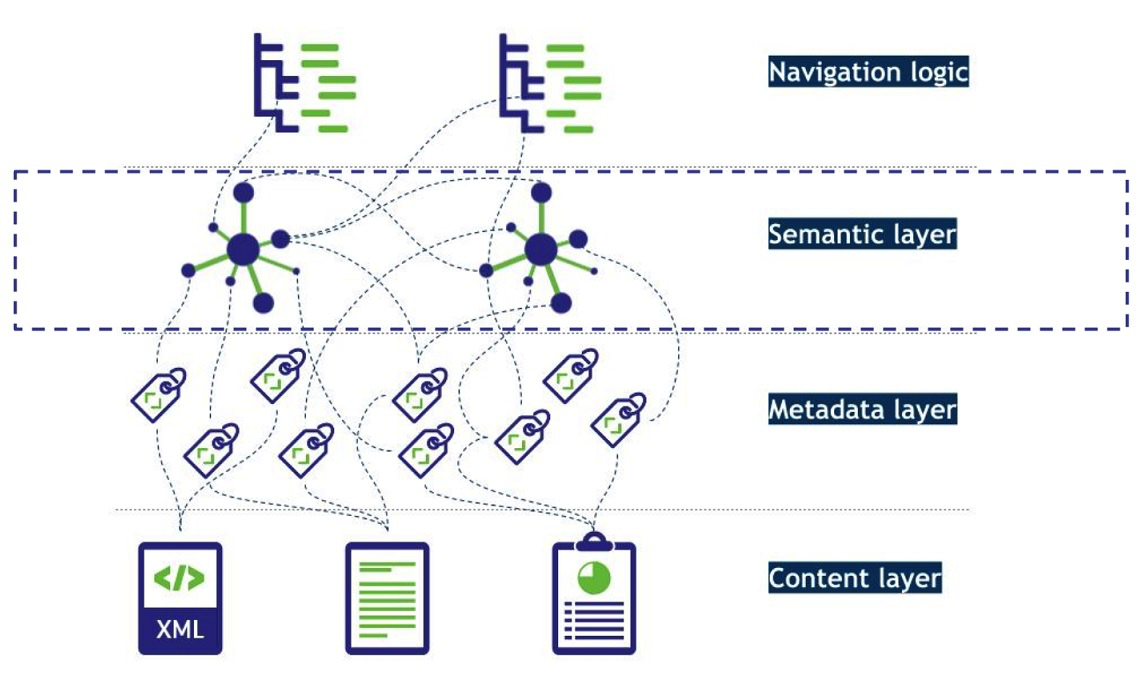
Knowledge graphs bring connections and data structures to information

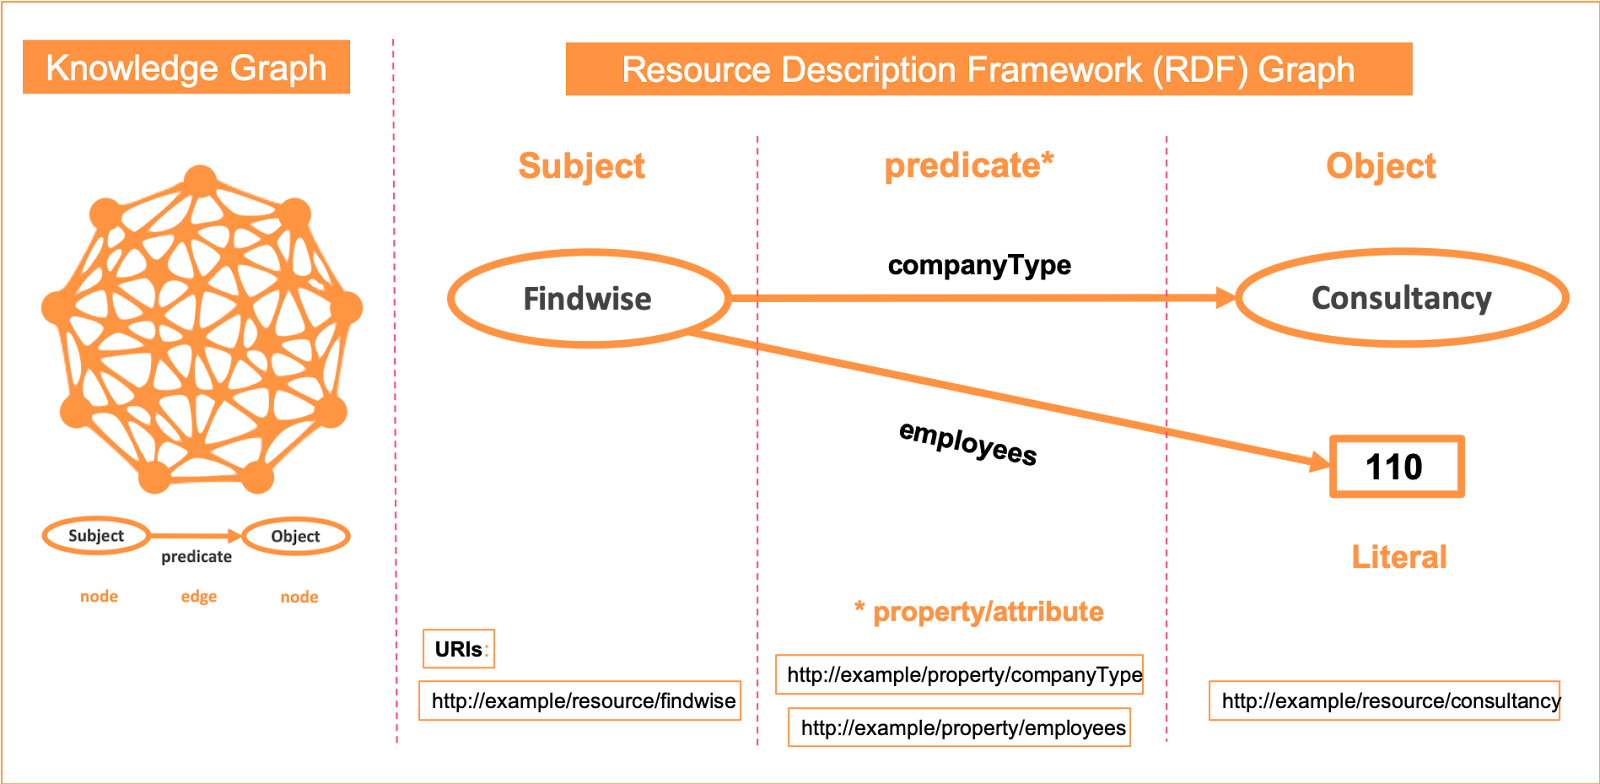
Knowledge graphs provides a semantic layer on the top of your database which provides you with all possible entities and the relationships between them. There are a number of representation and modeling instruments available for building a knowledge graph, ontologies being one of them.

Ontology comprises of classes, relationships and attributes as shown in Figure 9. This offers a robust way to store information and concepts – similar to how humans store information.

FIGURE 4: OVERVIEW OF A KNOWLEDGE GRAPH WITH AN RDF SCHEMA

FIGURE 4: OVERVIEW OF A KNOWLEDGE GRAPH WITH AN RDF SCHEMA

A chatbot based on ontology can help to clarify the user’s context and intent – and it can dynamically suggest related topics. Knowledge graphs represent the knowledge of an organization,  as depicted in the following Figure 10. Consider a knowledge graph based on an organization (as shown on the right image in Figure 10) and a chatbot (as shown on the left image in Figure 10) which is based on the ontology of this knowledge graph. In the chatbot example in Figure 10, the user asks a question about a specific employee. The NLP detects the employee as an entity and also detects the intent behind asking a question about this entity. The chatbot matches the employee entity in the ontology and navigates to the node in the graph. From that node we now know all possible relationships of that entity and the chatbot will ask back for possible options, such as co-workers and projects, to navigate further.

FIGURE 5: A SCENARIO - HOW A CHATBOT CAN INTERACT WITH A USER WITH A KNOWLEDGE GRAPH.

FIGURE 5: A SCENARIO – HOW A CHATBOT CAN INTERACT WITH A USER WITH A KNOWLEDGE GRAPH.

Moreover, the knowledge graph also improves the NLU in a chatbot. For example, if a user asks the following;

  • ‘Which assignments was employee A part of?’. To navigate further in the knowledge graph, a rank system can be created for possible connections from the employee node. This rank system might be based on word vector space and a similarity score.
  • In this scenario, ‘worked in, projects’ will have the highest rank when calculating the score with ‘part of, assignments’. So, the chatbot would know it needs to return the list of corresponding projects.

Virtual assistants with Lucidworks Fusion

Lucidworks Fusion is an example of a platform that supports building conversation interfaces. Fusion includes NLP features to understand the meaning of content and user intent. In the end, it’s all about retrieving the right answer at the right time. Virtual assistants, with a more human level of understanding, goes beyond static rules and profiles. It uses machine learning to predict user intention and provides insights. Customers and employees can locate critical insights to help them move to their next best action.

FIGURE 6: LUCIDWORKS FUSION DATA FLOW

FIGURE 6: LUCIDWORKS FUSION DATA FLOW

Lucidworks recently announced Smart Answers – new Fusion’s feature. Smart Answers enhances the intelligence of chatbots and virtual assistants by using deep learning to understand natural language questions. It uses deep learning models and mathematical logic to match the similarity of a question (which can be asked in many different ways) to the most relevant answer. As users interact with the system, Smart Answers continues to rank all answers and improve relevancy.

Fusion is focused on understanding a user’s intent. Smart Answers includes model training and serving methods for different scenarios:

  • When FAQs or question-answer pairs exist, they can be easily integrated into Smart Answers’ model training framework,
  • When there are no FAQ or question-answer pairs, knowledge base documents can be used to train deep learning models and match existing knowledge for the best answers to incoming queries. Once users click on documents returned for specific queries, they become question-answers pairs signals and can enrich the FAQ model training framework,
  • When there are no documents internally, Smart Answers uses cold-start models trained on large online sources, available in multiple languages. Once it goes live, the models begin training on actual user signals.

Smart Answers’ API enables easy integration with any platform, knowledge base, adding value to existing applications. One of the strengths of Fusion Smart Answers is integration with Rasa, an open-source conversation engine. It’s a framework that helps with understanding user intention and maintaining dialogue flow. It also has prebuilt NLP components such as word vectors, tokenizers, intent classifiers and entity extractor. Rasa allows to configure the pipeline that processes a user’s message and analyze human language. Another part of this engine enables modeling dialogues, so chatbot knows what the next action or response should be.

intent:greet 
- Hi 
- Hey 
- Hi bot 
- Hey bot 
 
## intent:request_restaurant 
- im looking for a restaurant 
- can i get [swedish](cuisine) food in any area. 
- a restaurant that serves [caribbean](cuisine) food. 
- id like a restaurant 
- im looking for a restaurant that serves [mediterranean](cuisine) food 
- can i find a restaurant that serves [chinese](cuisine)

Building chatbots requires a lot of training examples for every intent and entity to make them understand the user intention, domain knowledge and to improve NLU of the chatbot. When building a simple chatbot, using prebuilt trained models can be useful and requires less training data. For example: If we build a chatbot where we only need to detect the common location entity, few examples and spaCy models can be enough. However, there might be cases when you need to build a chatbot for an organization where you need different contextual entities – which might not be available in the pretrained models. Knowledge graphs can then be helpful to have a domain knowledge for a chatbot and can balance the amount of work related to training data.

Conclusion

Two main chatbot usages are: 1/solving employee frustration in accessing e.g. corporate information and 2/providing customers with answers to support questions. Both examples above are looking for a solution to reduce time spent on finding information. Especially for online commerce, key performance indicators are clear and can relate to e.g. decreasing call center traffic or call deflection from web and email – examples of situations where ontology based chatbots can be very helpful. From a short-term perspective creating a knowledge graph can initially require a lot of effort – but from a long-term perspective it can also create a lot of value. Companies rely on digital portals to provide information to users; employees search for HR or organization policies documents. Online retailers try to increase customers’ self-service in solving their problems or simply want to improve discovery of their products and services. With solutions like e.g. Fusion Smart Answers, we are able to cut down time-to-resolution, increase customer retention and take knowledge sharing to the next level. It helps employees and customers resolve issues more quickly and empowers users to find the right answer immediately without seeking out additional, digital channels.

Authors: Pragya Singh, Pedro Custodio, Tomasz Sobczak

To read more:

  1. Ehud Reiter and Robert Dale. 1997. Building applied natural language generation systems. Nat. Lang. Eng. 3, 1 (March 1997), 57–87. DOI:https://doi.org/10.1017/S1351324997001502.
  2. Challenges in Building Intelligent Open-domain Dialog Systems by Huang, M.; Zhu, X.; Gao, J.
  3. A Novel Approach for Ontology-Driven Information Retrieving Chatbot for Fashion Brands by Aisha Nazir, Muhammad Yaseen Khan, Tafseer Ahmed, Syed Imran Jami, Shaukat Wasi
  4. https://medium.com/@BhashkarKunal/conversational-ai-chatbot-using-rasa-nlu-rasa-core-how-dialogue-handling-with-rasa-core-can-use-331e7024f733
  5. https://lucidworks.com/products/smart-answers/

Toward data-centric solutions with Knowledge graphs

In the last blog posts [1, 2] in this series by Fredric Landqvist and Peter Voisey we have outlined for you, at a high level, about the benefits of making data smarter and F.A.I.R., ideally made findable through a shareable, but controlled, type of Information Commons. In this post, we introduce you to Knowledge Graphs (based on Semantic Web Technologies), the source for the magic of smart and FAIR data automation. Data that is findable, accessible, interoperable and reusable. They can help tackle a range of problems, from the data tsunami to the scarcity of (quality) data for that next AI project.

What is a Knowledge Graph?

There are several different types of graph and certainly many have been many attempted definitions of a Knowledge Graph. Here’s ours:

A Knowledge Graph is the structural representation of explicit knowledge for a domain, encoded in such a way that both humans and machines can read (process) it.

Ultimately, we are wanting to exploit data and their connections or relationships within the graph format in order to surface important and relevant data and information. Without these relationships, the understandings, the stories and the searches around our data tend to dry up fairly quickly. Our world is increasingly connected. So we hope, from an organisational perspective, you are asking: Why isn’t our data connected?!

Where does the term “Knowledge Graph” come from?

The term Knowledge Graph was coined by Google on the release of its own Knowledge Graph in 2012. More recently, organisations have been cottoning on to the collective benefits of employing a Knowledge Graph, so much so, that many refer to the Enterprise Knowledge Graph today.

What are the technologies behind the Enterprise Knowledge Graph?

The Enterprise Knowledge Graph is based on a stack of W3C-ratified Semantic Web Technologies. As their name alludes to, they form the basis of the Semantic Web. Their formulation began in 2001 with Sir Tim Berners-Lee. Sir Tim, not content with giving us the World Wide Web for free, pictured a web of connected data and concepts, besides the web of linked documents, so that machines would be able to understand our requests by virtue of known connections and relationships.

Why Enterprise Knowledge Graphs now?

These technologies are complex to the layperson and some of them are nearly 20 years old. What’s changed to make Enterprises take note of them now? Well worsening internal data management problems, the need for some knowledge input for most sustainable AI projects and the fact that Knowledge Graph building tools have improved to become collaborative and more user-friendly for the knowledge engineer, domain expert and business executive. The underlying technologies in new tools are more hidden from the end user’s perspective, allowing them to concentrate on encoding their knowledge so that it can be used across enterprise systems and applications. In essence, linking enterprise data.

Thanks to Google’s success in using their Knowledge Graph with their search, Enterprise Knowledge Graphs are becoming recognised as the difference between “googling” and using the sometimes-less-than-satisfying enterprise consumer-facing or intranet search.

The key takeaway here though is that real power of any knowledge graph is in its relationships/connections between concepts. We’ll look into this in more detail next.

RDF, at the heart of the Enterprise Knowledge Graphs (EKGs)

EKGs use the simple RDF graph data model at their base. RDF stands for Resource Description Framework – a framework for the way resources or things are described so that we can recognise more easily plus understand more about them.

An aside: We’re talking RDF (namespace) Knowledge Graphs here, rather than their sister graph type, Property Graphs, which we will cover in a future post. It is important to note that there are advantages with both types of graph and indeed new technologies are being developed, so processes can straddle both types.

The RDF graph data model describes a thing or a resource in terms of “triples”: Subject – predicate – Object. The diagram below illustrates this more clearly with an example.


Figure 1. What does a Knowledge Graph look like? The RDF elements of a Knowledge Graph

The graph consists of nodes (vertices) that represent entities (a.k.a. concepts both concrete and abstract, terms, phrases, but now think things, not strings), and edges (lines or arrows) representing the relationships between nodes. Each concept and each relationship have their own URI (a kind of ID), that helps a search engine or application understand their meaning to spot differences (disambiguation) e.g. homonyms (words spelt or pronounced similarly, but that have different meaning) or similarities e.g. alternative labels, synonyms, acronyms, misspellings, foreign language term equivalents etc.

Google uses its Knowledge Graph when it crawls websites to recognise entities like: People, Places, Products, Organisations and more recently Topics, plus all their known relationships between them. There is often a dire need within most organisations for readily available knowledge about People and their related Roles, Skills/Competencies, Projects, Organisations/Departments and Locations.

There are of course many other well-known Knowledge Graphs now including IBM’s Watson,  Microsoft’s Academic Knowledge Graph, Amazon’s Cortex Knowledge Graph, the Bing Knowledge Graph etc.

One thing to note about Google is that the space devoted to their organic (non-paid for) search results has reduced dramatically over the last ten years. In place, they have used their Knowledge Graph to better understand the end user’s query and context. Information too is served automatically based on query concept relationships, either within an Information Panel or as commonly known Questions and Answers (Q&As). Your employees (as consumers) of course are at home with this intuitive, easy-click user experience. While Google’s supply of information has become sharper, so has its automatic assessment of all webpage content, relying increasingly on websites to provide it with semantic information e.g. declaring their “aboutness” by using schema.org or other microformats in their markup rather than relying on SEO keywords.

How does Knowledge Graph engineering differ from traditional KM/IM processes?

In reality, not that much. We still want the same governing principles that can give data good structure, metadata, context and meaning.

Constructing a Knowledge Graph can still be likened to the development of taxonomy or thesaurus with their concepts and an ontology (the relationships between concepts). Here the relationships include firstly: poly-hierarchical relationships (in terms of the taxonomy): a concept may have several broader concepts meaning that the concept itself (with its own URI) can appear in multiple times within a taxonomy. This polyhierarchy can be exploited later for example in both search filtering and website navigation.

Secondly, relationships can also be associative/relational with regards to meaning and context – your organisation’s own made +/or industry-adopted concepts and the key relationships that define your business, and even its goals, strategy and workflows.

A key difference though is the way in which you can think about your data and its organisation. It is no longer flat or 2-D, but rather think 3-D and 360-degree concept- or consumer-centric views to see how they connect to other concepts.

A semantic layer for Automatic Annotation, smarter data & semantic search

We will look at the many different benefits of a Knowledge Graph and further use cases in the next post, but for now, we go with the magic that an EKG can sit virtually on top of any or all your data sources (with different formats and metadata) without the need to move or copy any data. Any data source or data catalogue then consumed via a processing pipeline can be automatically and consistently be annotated (“tagged”) and classified according to declared industry or in-house standards, thus becoming more structured and its meaning more readily “understood,” ready to be found and consumed in accordance with any known or stated conditions.

The classification may also extend to including levels of data security and sensitivity, provenance or trust or location, device and time accessibility.

Figure 2 The automatic annotation & classification process for making data/content smart by using an Enterprise Knowledge Graph

It’s often assumed, incorrectly, that there is only one Enterprise Knowledge Graph. Essentially an enterprise can have one or many, perhaps overlapping graphs for different purposes, subject domains or applications. The importance is that knowledge becomes encoded and readily usable for humans and machines.

What’s wrong with Relational Databases?

There’s nothing wrong with relational databases per se and Knowledge Graphs will not necessarily replace them any time soon. It’s good to note though that data in tabular format can be converted to RDF graph data (triples/tuples) relatively easily and stored in a triple store (Graph Database) or some equivalent. 

In relational databases, references to other rows and tables are indicated by referring to primary key attributes via foreign key columns. Joins are computed at query time by matching primary and foreign keys of all rows in the connected tables. 

Understanding the connections or relations is usually very cumbersome, and those types of costly join operations are often addressed by denormalizing the data to reduce the number of joins necessary, therefore breaking the data integrity of a relational database.

The data models for relational versus graph are different. If you are used to modelling with relational databases, remember the ease and beauty of a well-designed, normalized entity-relationship diagram (i.e using UML) –  a graph is exactly that – a clear model of the domain. Each node (entity or attribute) in the graph model directly and physically contains a list of relationship records that represent the relationships to other nodes. These relationship records are organized by type and direction and may hold additional attributes.

Querying relational databases is easy with SQL. The graph has something similar by using SPARQL, a query language for RDF. If you have ever tried to write a SQL statement with a large number of joins, you know that you quickly lose sight of what the query actually does. In SPARQL, the syntax remains concise and focused on domain components and the connections among them.

Toward data-centric solutions with RDF

With enterprise-linked-data, as with knowledge graphs, one is able to connect many different schemas (data models) and formats in different relational databases and build a connected worldview, domain of discourse. Herein lays the strengths with linking-data, and liberating data from lock-in mechanisms either by schemas (data models) or vendor (software). To do queries and inferencing to find new knowledge and insights that were not possible before due to time or human computation factors. Semantics support this reasoning!

Of course, having interoperable graph data means could well mean fewer code patches on individual systems and more sustainable and agile data-centric solutions in the future.

In conclusion

The expression “in the right place, at the right time” is generally associated with luck. We’ve been talking in our enterprises about “the right information, in the right place, at the right time” for ages, unfortunately sometimes with similar fortune attached. The opportunity is here now to embark on a journey to take back control of your data if you haven’t already, and make it an asset again in achieving your enterprise aims and goals.

More reading on graphs and linked enterprise data:

Next up in the series: Knowledge Graphs: The collective Why?

View Fredric Landqvist's LinkedIn profileFredric Landqvist research blog
View Peter Voisey's LinkedIn profilePeter Voisey

Making your data F.A.I.R and smart

This is the second post in a new series by Fredric Landqvist & Peter Voisey, explaining how your organisation could best shape its data landscape for the future.

How to create a smart data framework for your organisation

In our last post for you, we presented the benefits of F.A.I.R data, how to make data smarter for search engines and the potentials of an Information Commons. In this post, we’re giving you the pragmatic steps to make your data FAIR by creating and applying your own smart data framework. Your data-sharing dream, internally and externally, is possible.

A smart data framework, using FAIR data principles, encompasses the tooling, models and standards that govern datasets and the different context-specific information systems (registers, catalogues). The data is then ingested and processed (enriched/refined) into smart data, datasets and data catalogues. It can then be used and reused by different applications and e-services via open APIs. In this ecosystem, all actors and information behaviours (personas) interplay: provision agents, owners, builders, enrichers, end-user searchers and referrers.

The workings of a smart data framework

A smart data & metadata catalogue   

A smart data & metadata catalogue (illustrated below), provides an organisational capability that aligns data management with the FAIR data principles. View it not so much as one system to rule them all, but rather an ecosystem that is smart and sustainable. In order to simplify your complex and heterogeneous information environment, this set-up can be  instantiated, as one overarching mechanism. Although we are describing a data and metadata catalogue here, the exact same framework and set up would of course apply also to your organisation’s content, making it smarter and more findable (i.e. it gets the sustainable stamp).

Smart Data Catalogue
The necessary services and component of a smart data catalogue

The above picture illustrates the services and components that, together, build smart data and metadata catalogue capabilities. We now describe each one of them for you:

Processing (Ingestion & Enrichment) for great Findability & Interoperability

  • (A) Ingest, harvest and operate. Here you connect the heterogeneous data sources for ingestion.

The configured input mechanisms describe each of the data sources, with their data, datasets and metadata ready for your catalogue search. Hopefully, at the dataset upload stage, you have provided a good system/form that now provides your search engine with great metadata (i.e. we recommend you use the open data catalogue standard DCAT-AP). The concept upload is interchangeable with either machine-to-machine harvester mechanisms, as with open-data, traditional data integration, or manual provision by human upload effort. (D) Enterprise Metadata Repository: here is the persistent storage of data in both data catalogue, index and graph. All things get a persistent ID (how to design persistent URI) and rich metadata.

  • (B) Enrich, refine analyze, and curate. This is the AI part (NLP, Semantics, ML) that enriches the data and datasets, making them smarter. 

Concepts (read also entities, terms, phrases, synonyms, acronyms etc.) from the data sources are found using named entity extraction (NER). By referring to a Knowledge Graph in the Enricher, the appropriate resources are annotated (“tagged”) with the said concept. It does not end here, however. The concept also takes with it from the Knowledge Graph all of the known relationships it has with other concepts.

Essentially a Knowledge Graph is your encoded domain knowledge in a connected graph format. It is by reading these encoded relationships that the machine “understands” the meaning or aboutness of data.

This opens up a very nice Pandora’s box for your search (understanding query intent) and for your Graphical User Interface (GUI) as your data becomes smarter now through your ability to exploit the relationships and connections (semantics and context) between concepts.

You and AI can have a symbiotic relationship in the development of your Knowledge Graph. AI can suggest new concepts and relationships as new data is added. It is, however, you and your colleagues who determine the of concepts/relationships in the Knowledge Graph – concepts/relationships that are important to your department or business. Remember you can utilise more than one knowledge graph, or part of one, for a particular business need(s) or data source(s). The Knowledge Graph is a flexible expression of your business/information models that give structure to all your data and its access.

Extra optional step: If you can manage not only to index the dataset metadata but the datasets themselves, you can make your Pandora’s box even nicer. Those cryptic/nonsensical field names that your traditional database experts love to create can also be incorporated and mapped (one time only!) into your Knowledge Graph, thus increasing the machine “understanding” of the data. Thus, there is a better chance of the data asset being used more widely. 

The configuration of processing with your Knowledge Graph can take care of dataset versioning, lineage and add further specific classifications e.g. data sensitivity, user access and personal information.

Lastly on Processing, your cultural and system interoperability is immensely improved. We’re not talking everyone speaking the same language here, rather everyone talking their language (/culture) and still being able to find the same thing. In this open and FAIR vocabularies further, enrich the meaning to data and your metadata is linked. System interoperability is partially achieved by exploiting the graph of connections that now “sit over” your various data sources.

Controlled Access (Accessible and Reusable)

  • (C) Access, search and visualize APIs. These tools control and influence the delivery, representation, exploration and consumption/use of datasets and data catalogues via a smarter search (made so by smarter data) and a more intuitive Graphical User interface (GUI).

This means your search can now “understand” user intent from just one or two keyword queries (through known relationship connections in the Knowledge Graph). 

Your search now also caters for your searchers who are searching in an unfamiliar subject area or are just having a query off day. Besides offering the standard results page, the GUI can also present related information (again due to the Knowledge Graph), past related user queries, information and question-answer (Q&A) type material. So: search, discovery, learning, serendipity.

Your GUI can also now become more intuitive, changing its information presentation and facets/filters automatically, depending on the query itself (more sustainable front-end coding). 

An alternative to complex scenario coding also includes the possibility for you to create rules (set in your Knowledge Graph) that can control what data users can access (when, how and where) based on their profile, their role, their location, the time and on the device they are using. This same Knowledge Graph can help push and recommend data for certain users proactively. Accessibility will be possible by using standard communication protocols, open access (when possible), authentication where necessary, and always with metadata at hand.

Reusable: your new smart data framework can help increase the time your Data Managers (/Scientists, Analysts) spend using data (and not trying to find it, the 80/20 data science dilemma). It can also help reduce the risk to your AI projects (50% failure rate) by helping searchers find the right data, with its meaning and context, more easily.  Reuse will also be possible with the design that metadata multiple attributes, use licence and provenance in line with community standards

Users and information behaviour (personas)

Users and personas
User groups and services

From experience we have defined the following broad conceptual user-groups:

  • Data Managers, a.k.a. Data Op’s or Data Scientists
    Data Managers are i.e. knowledge engineers, taxonomists and analysts. 
  • Data Stewards
    Data Stewards are responsible for Data Governance, such as data lineage. 
  • Business Professionals/Business end-users
    Business Users may have a diverse background. Hence Business end-users.
  • Actor System are different information systems and applications and services that integrate information via the rich open APIs from the Smart Data Catalogue

The outlined collaborative actors (E-H user groups) and their interplay as information behaviour (personas) with the data (repository) and services (components), together, build the foundation for a more FAIR data management within your organisation, providing for you at the same time, the option to contribute to an even broader shared open FAIR information commons.

  • (E) Data Op’s workplace and dashboard is a combination of tools supporting Data Op’s data management processes in the information behaviours: data provision agents, enrichers and developers.
  • (F) Data Governance workplace is the tools to support Data Stewards collaborative data governance work with Data Managers in the information behaviours: data owner.
  • (G) Access, search, visualize APIs, is the user experience to explore, find and interact with the catalogue and data in the information behaviours: searcher and referrer.
  • (H) API, is the set of open APIs to support access to catalogue data for consuming information systems in the information behaviours: referrer (a.k.a. data exchange).

Potential tooling for this smart data framework:

We hope you enjoyed this post and understand the potential benefits such a smart data framework incorporating FAIR data principles can have on your data catalogue, or for that matter, your organisational content or even your data swamps.


In the next post, Toward data-centric solutions with Knowledge Graphs, we talk about Knowledge Graphs (KG) and its non-proprietary RDF semantic web tech, how you can create your KG(s) and the benefits they can bring to your future data landscape.

View Fredric Landqvist's LinkedIn profileFredric Landqvist research blog
View Peter Voisey's LinkedIn profilePeter Voisey

Beyond Office 365 – knowledge graphs, Microsoft Graph & AI!

This is the first joint post in a series where Findwise & SearchExplained, together decompose Microsoft’s realm with the focus on knowledge graphs and AI. The advent of graph technologies and more specific knowledge graphs have become the epicentre of the AI hyperbole.

microsoft_graph

The use of a symbolic representation of the world, as with ontologies (domain models) within AI is by far nothing new. The CyC project, for instance, started back in the 80’s. The most common use for average Joe would be by the use of Google Knowlege Graph that links things and concepts. In the world of Microsoft, this has become a foundational platform capacity with the Microsoft Graph.

It is key to separate the wheat from the chaff since the Microsoft Graph is by no means a Knowledge Graph. It is a highly platform-centric way to connect things, applications, users and information and data. Which is good, but still it lacks the obvious capacity to disambiguate complex things of the world, since this is not its core functionality to build a knowledge graph (i.e ontology).

From a Microsoft centric worldview, one should combine the Microsoft Graph with different applications with AI to automate, and augment the life with Microsoft at Work. The reality is that most enterprises do not use Microsoft only to envelop the enterprise information landscape. The information environment goes far beyond, into a multitude of organising systems within or outside to company walls.

Question: How does one connect the dots in this maze-like workplace? By using knowledge graphs and infuse them into the Microsoft Graph realm?

Office 365 MDM

The model, artefacts and pragmatics

People at work continuously have to balance between modalities (provision/find/act) independent of work practice, or discipline when dealing with data and information. People also have to interact with groups, and imaged entities (i.e. organisations, corporations and institutions). These interactions become the mould whereupon shared narratives emerge.

Knowledge Graphs (ontologies) are the pillar artefacts where users will find a level playing field for communication and codification of knowledge in organising systems. When linking the knowledge graphs, with a smart semantic information engine utility, we get enterprise-linked-data that connect the dots. A sustainable resilient model in the content continuum.

Microsoft at Work – the platform, as with Office 365 have some key building blocks, the content model that goes cross applications and services. The Meccano pieces like collections [libraries/sites] and resources [documents, pages, feeds, lists] should be configured with sound resource descriptions (metadata) and organising principles. One of the back-end service to deal with this is Managed Metadata Service and the cumbersome TermStore (it is not a taxonomy management system!). The pragmatic approach will be to infuse/integrate the smart semantic information engine (knowledge graphs) with these foundation blocks. One outstanding question, is why Microsoft has left these services unchanged and with few improvements for many years?

The unabridged pathway and lifecycle to content provision, as the creation of sites curating documents, will be a guided (automated and augmented [AI & Semantics]) route ( in the best of worlds). The Microsoft Graph and the set of API:s and connectors, push the envelope with people at centre. As mentioned, it is a platform-centric graph service, but it lacks connection to shared narratives (as with knowledge graphs).  Fuzzy logic, where end-user profiles and behaviour patterns connect content and people. But no, or very limited opportunity to fine-tune, or align these patterns to the models (concepts and facts).

Akin to the provision modality pragmatics above is the find (search, navigate and link) domain in Office 365. The Search road-map from Microsoft, like a yellow brick road, envision a cohesive experience across all applications. The reality, it is a silo search still 😉 The Microsoft Graph will go hand in hand to realise personalised search, but since it is still constraint in the means to deliver a targeted search experience (search-driven-application) in the modern search. It is problematic, to say the least. And the back-end processing steps, as well as the user experience do not lean upon the models to deliver i.e semantic-search to connect the dots. Only using the end-user behaviour patterns, end-user tags (/system/keyword) surface as a disjoint experience with low precision and recall.

The smart semantic information engine will usually be a mix of services or platforms that work in tandem,  an example:

  1. Semantic Tools (PoolParty, Semaphore)
  2. Search and Analytics (i3, Elastic Stack)
  3. Data Integration (Marklogic, Biztalk)
  4. AI modules (MS Cognitive stack)

In the forthcoming post on the theme Beyond Office 365 unpacking the promised land with knowledge graphs and AI, there will be some more technical assertions.
View Fredric Landqvist's LinkedIn profileFredric Landqvist research blog
View Agnes Molnar's LinkedIn profileAgnes Molnar SearchExplained

.

Tinkering with knowledge graphs

I don’t want to sail with this ship of fools, on the opulent data sea, where people are drowning without any sense-making knowledge shores in sight. You don’t see the edge before you drop!

Knowledge EngineeringEchoencephalogram (Lars Leksell)  and neural networks

How do organisations reach a level playing field, where it is possible to create a sustainable learning organisation [cybernetics]?
(Enacted Knowledge Management practices and processes)

Sadly, in many cases, we face the tragedy of the commons!

There is an urgent need to iron out the social dilemmas and focus on motivational solutions that strive for cooperation and collective action. Knowledge deciphered with the notion of intelligence and emerging utilities with AI as an assistant with us humans. We the peoples!

To make a model of the world, to codify our knowledge and enable worldviews to complex data is nothing new per se. A Knowlege Graph – is in its essence a constituted shared narrative within the collective imagination (i.e organisation). Where facts of things and their inherited relationships and constraints define the model to be used to master the matrix.  These concepts and topics are our communication means to bridge between groups of people. Shared nomenclatures and vocabularies.

Terminology Management

Knowledge Engineering in practice


At work – building a knowledge graph – there are some pillars, that the architecture rests upon.  First and foremost is the language we use every day to undertake our practices within an organisation. The corpus of concepts, topics and things that revolve around the overarching theme. No entity act in a vacuum with no shared concepts. Humans coordinate work practices by shared narratives embedded into concepts and their translations from person to person. This communication might be using different means, like cuneiform (in ancient Babel) or digital tools of today. To curate, cultivate and nurture a good organisational vocabulary, we also need to develop practices and disciplines that to some extent renders similarities to ancient clay-tablet librarians. Organising principles, to the organising system (information system, applications).  This discipline could be defined as taxonomists (taxonomy manager) or knowledge engineers. (or information architect)

Set the scope – no need to boil the ocean


All organisations, independent of business vertical, have known domain concepts that either are defined by standards, code systems or open vocabularies. A good idea will obviously be to first go foraging in the sea of terminologies, to link, re-hash/re-use and manage the domain. The second task in this scoping effort will be to audit and map the internal terrain of content corpora. Since information is scattered across a multitude of organising systems, but within these, there are pockets of a structure. Here we will find glossaries, controlled vocabularies, data-models and the like.  The taxonomist will then together with subject matter experts arrange governance principles and engage in conversations on how the outer and inner loop of concepts link, and start to build domain-specific taxonomies. Preferable using the simple knowledge organisation system (SKOS) standard

Participatory Design from inception


Concepts and their resource description will need to be evaluated and semantically enhanced with several different worldviews from all practices and disciplines within the organisation. Concepts might have a different meaning. Meaning is subjective, demographic, socio-political, and complex. Meaning sometimes gets lost in translation (between different communities of practices).

The best approach to get a highly participatory design in the development of a sustainable model is by simply publish the concepts as open thesauri. A great example is the HealthDirect thesaurus. This service becomes a canonical reference that people are able to search, navigate and annotate.

It is smart to let people edit and refine and comment (annotate) in the same manner as the Wikipedia evolves, i.e edit wiki data entries. These annotations will then feedback to the governance network of the terminologies. 

Term Uppdate

Link to organising systems

All models (taxonomies, vocabularies, ontologies etc.) should be interlinked to the existing base of organising systems (information systems [IS]) or platforms. Most IS’s have schemas and in-built models and business rules to serve as applications for a specific use-case.  This implies also the use of concepts to define and describe the data in metadata, as reference data tables or as user experience controls. In all these lego pieces within an IS or platform, there are opportunities to link these concepts to the shared narratives in the terminology service.  Linked-enterprise-data building a web of meaning, and opening up for a more interoperable information landscape.

One omnipresent quest is to set-up a sound content model and design for i.e Office 365, where content types, collections, resource descriptions and metadata have to be concerted in the back-end services as managed-metadata-service. Within these features and capacities, it is wise to integrate with the semantic layer. (terminologies, and graphs). Other highly relevant integrations relate to search-as-a-service, where the semantic layer co-acts in the pipeline steps, add semantics, link, auto-classify and disambiguate with entity extraction. In the user experience journey, the semantic layer augments and connect things. Which is for instance how Microsoft Graph has been ingrained all through their platform. Search and semantics push the envelope 😉

Data integration and information mechanics

A decoupled information systems architecture using an enterprise service bus (messaging techniques) is by far the most used model.  To enable a sustainable data integration, there is a need to have a data architecture and clear integration design. Adjacent to the data integration, are means for cleaning up data and harmonise data-sets into a cohesive matter, extract-load-transfer [etl]. Data Governance is essential! In this ballpark we also find cues to master data management. Data and information have fluid properties, and the flow has to be seamless and smooth.  

When defining the message structure (asynchronous) in information exchange protocols and packages. It is highly desired to rely on standards, well-defined models (ontologies). As within the healthcare & life science domain using Hl7/FHIR.  These standards have domain-models with entities, properties, relations and graphs. The data serialisation for data exchange might use XML or RDF (JSON-LD, Turtle etc.). The value-set (namespaces) for properties will be possible to link to SKOS vocabularies with terms.

Query the graph

Knowledge engineering is both setting the useful terminologies into action, but also load, refine and develop ontologies (information models, data models). There are many very useful open ontologies that could or should be used and refined by the taxonomists, i.e ISA2 Core Vocabularies, With data-sets stored in a graph (triplestore) there are many ways to query the graph to get results and insights (links). Either by using SPARQL (similar to SQL in schema-based systems), or combine this with SHACL (constraints) or via Restful APIs.

These means to query the knowledge graph will be one reasoning to add semantics to data integration as described above.

Adding smartness and we are all done…

Semantic AI or means to bridge between symbolic representation (semantics) and machine learning (ML), natural language processing (NLP), and deep-learning is where all thing come together.

In the works (knowledge engineering) to build the knowledge graph, and govern it, it taxes many manual steps as mapping models, standards and large corpora of terminologies.  Here AI capacities enable automation and continuous improvements with learning networks. Understanding human capacities and intelligence, unpacking the neurosciences (as Lars Leksell) combined with neural-networks will be our road ahead with safe and sustainable uses of AI.
View Fredric Landqvist's LinkedIn profileFredric Landqvist research blog

Benevolent & sustainable smart city development

The digitisation of society emerge in all sectors, and the key driver to all this is the abundance of data that needs to be brought into context and use.

Participation

When discussing digitisation, people commonly think in data highways and server farms as being the infrastructure. Access to comprehensive information resources is increasingly becoming a commodity, enabling and enhancing societal living conditions. To achieve this, sense-making of data has to be in integrative part of the digital infrastructure. Reflecting this to traditional patterns, digital roads need junctions, signs and semaphores to function, just as their physical counterparts.

The ambition with AI and smart society and cities should be for the benefit of its inhabitants, but without a blueprint to get a coherent model that will be working in all these utilities, it will all break. Second to this, benevolence, participation and sustainability, have to be the overarching theme, to contrast dystopian visions with citizen surveillance and fraudulent behaviour.

Data needs context to make sense and create value, and this frame of reference will be realised through domain models of the world, with shared vocabularies to disambiguate concepts. In short a semantic layer. It is impossible to boil the ocean, which makes us rather lean toward a layered approach.

All complex systems (or complex adaptive system, CAS) revolve around a set of autonomous agents, for example, cells in a human body or citizens in an urban city. The emergent behaviour in CAS is governed by self-organising principles. A City Information Architecture is by nature a CAS, and hence the design has to be resilient and coherent.

What infrastructural dimensions should a smart city design build upon?

  • Urban Environment, the physical spaces comprised of geodata means, register of cadastre (real-estate), roads and other things in the landscape.
  • Movable Objects, with mobile sensing platforms capturing things like vehicles, traffic and more, in short, the dynamics of a city environment.
  • Human actor networks, the social economic mobility, culture and community in the habitat
  • Virtual Urban Systems augmented and immersive platforms to model the present or envision future states of the city environment

Each of these organising systems and categories holds many different types of data, but the data flows also intertwine. Many of the things described in the geospatial and urban environment domain, might be enveloped in a set of building information models (BIM) and geographical information systems (GIS). The resource descriptions link the objects, moving from one building to a city block or area. Similar behaviour will be found in the movable object’s domain because the agents moving around will by nature do so in the physical spaces. So when building information infrastructures, the design has to be able to cross-boundaries with linked-models for all useful concepts. One way to express this is through a city information model (CIM).

When you add the human actor networks layer to your data, things will become messy. In an urban system, there are many organisations and some of these act as public agencies to serve the citizens all through the life and business events. This socially knitted interaction model, use the urban environment and in many cases moveble objects. The social life of information when people work together, co-act and collaborate, become the shared content continuum.
Lastly, data from all the above-mentioned categories also feeds into the virtual urban system, that either augment the perceived city real environment, or the city information modelling used to create instrumental scenarios of the future state of the complex system.

Everything is deeply intertwingled

Connect people and things using semantics and artificial intelligence (AI) companions. There will be no useful AI without a sustainable information architecture (IA). Interoperability on all levels is the prerequisite; systemic (technical and semantic),  organisational (process and climate).

Only when we follow the approach of integration and the use of a semantic layer to glue together all the different types and models – thereby linking heterogeneous information and data from several sources to solve the data variety problem – are we able to develop an interoperable and sustainable City Information Model (CIM).

Such model can not only be used inside one city or municipality – it should be used also to interlink and exchange data and information between cities as well as between cities and provinces, regions, countries and societal digitalisation transformation.

A semantic layer completes the four-layered Data & Content Architecture that usual systems have in place:

semantic-layer

Fig.: Four layered content & data architecture

Use standards (as ISA2), and meld them into contextual schemas and models (ontologies), disambiguate concepts and link these with verbatim thesauri and taxonomies (i.e SKOS). Start making sense and let AI co-act as companions (Deep-learning AI) in the real and virtual smart city, applying semantic search technologies over various sources to provide new insights. Participation and engagement from all actor-networks will be the default value-chain, the drivers being new and cheaper, more efficient smart services, the building block for the city innovation platform.

The recorded webinar and also the slides presented


View Fredric Landqvist's LinkedIn profileFredric Landqvist research blog
View Peter Voisey's LinkedIn profilePeter Voisey
View Martin Kaltenböck's LinkedIn profileMartin Kaltenböck
View Sebastian Gabler's LinkedIn profileSebastian Gabler

Digital recycling & knowledge growth

How do we prevent the digital debris of human clutter and mess? And to what extent will future digital platforms guide us in knowledge creation and use?

Start making sense, and the art of making sense!

People and the Post, Postal History from the Smithsonian's  National Postal Museum

People and the Post, Postal History from the Smithsonian’s National Postal Museum

Mankind’s preoccupation for much of this century has to become fully digitalized. Utilities, software, services and platforms are all becoming an ‘intertwingled’ reality for all of us. Being mobile, the blurring of the borders between the workplace and recreational life plus the ease of digital creation are creating information overloads and (out-of-sight) digital landfills. While digital content creation is cheaper to create and store, its volume and its uncared for status makes it harder for everyone else to find and consume the bits they really need (and have some provenance for peace of mind).

Fear not. A collection of emerging digital technologies exist that can both support and maintain future sustainable digital recycling – things like: Cognitive Computing, Artificial Intelligence; Natural Language Processing; Machine Learning and the like, Semantics adding meaning to shared concepts, and Graphs linking our content and information resources. With good information management practice and having the appropriate supporting tools to tinker with, there is a great opportunity to not only automate knowledge digitization but to augment it.

Automation

In the content continuum (from its creation to its disposal) there is a great need for automating processes as much as possible in order to reduce the amount of obsolete or hidden (currently value-less) digital content. Digital knowledge recycling is difficult as nearly every document or content creator is, by nature, reluctant to add further digital tags (a.k.a. metadata) describing their content or documents once they have been created. What’s more experience shows this is inefficient on a number of accounts, one of which is inconsistency.

Most digital documents (and most digital content, unless intended to sell something publicly) therefore lack the proper recycling resource descriptors that can help with e.g. classification, topic description or annotation with domain specific (shared, consistent) concepts. Such descriptions add appropriate meaning or context to content, aiding its further digital reuse (consumption). Without them, the problem of findability is likely to remain omnipresent across many intranets and searched resources.

Smartphones generate content automatically, often without the user thinking or realizing. All kinds of resource descriptors (time, place etc.) are created automatically through movement and mobile usage. With the addition of further machine learning and algorithms, online services such as Google Photos use these descriptors (and some automatic annotation of their own) to add more contextual data before classifying pictures into collections. This improved data quality (read: metadata addition and improved findability) allows us to find the pictures or timeline we want more easily.

In the very same manner, workplace content or documents can now have this same type of supporting technical platform that automatically adds additional business specific context and meaning. This could include data from users: their profiles, departments or their system user behaviour patterns.

For real organizational agility though a further extra layer of automatic annotation (tagging) and classification is needed – achieved using shared models of the business. These models can be expressed through a combination of various controlled vocabularies (taxonomies) that can be further joined through relationships (ontologies) and finally published (publicly or privately) as domain models as linked data (in graphs). Within this layer exist not just synonyms, but alternative and preferred labels, and more importantly relationships can be expressed between concepts – hence the graph: concepts being the dots (nodes) with relationships the joining lines (vertices). Using certain tools, the certain relationships between concepts can be further given a weighting.

This added layer generates a higher quality of automated context, meaning and consistency for the annotation (tagging) of content and documents alike. The very same layer feeds information architecture in the navigation of resources (e.g. websites). In Search, it helps to disambiguate between queries (e.g. apple the fruit, or apple the organization?).

This digital helper application layer works very much in the same smooth manner as e.g. Google Photos, i.e. in the background, without troubling the user.

This automation however, will not work without sustainable organizing principles, applied in information management practices and tools. We still need a bit of human touch! (Just as Google Photos added theirs behind the scenes earlier, as a work in progress)

Augmentation

This codification or digitalization of knowledge allows content to be annotated, classified and navigated more efficiently. We are all becoming more aware of the Google Knowledge Graph or the Microsoft Graph that can connect content and people. The analogy of connecting the dots in a graph is like linking digital concepts and their known relationships or values.

Augmentation can take shape in a number of forms. A user searching for a particular query can be presented not only with the most appropriate search results (via the sense-making connections and relationships) but also can be presented with related ideas they had not thought of or were unaware of – new knowledge and serendipity!

Search, semantic, and cognitive platforms have now reached a much more useful level than in earlier days of AI. Through further techniques new knowledge can also be discovered by inference, using the known relationships within the graph to fill in missing knowledge.

Key to all of this though is the building of a supporting back-end platform for continuous improvement in the content continuum. Technically, something that is easier to start than one may first suspect.

Sustainable Organising Principles to the Digital Workplace


View Fredric Landqvist's LinkedIn profileFredric Landqvist research blog
View Peter Voisey's LinkedIn profilePeter Voisey

Generational renewal at work – a search challenge

The big generational shift

There have been discussions surrounding the great generational renewal in the workplace for a while. The 50’s generation, who have spent a large part of their working lives within the same company, are being replaced by an agile bunch born in the 90’s. We are not taken by tabloid claims that this new generation does not want to work, or that companies do not know how to attract them. What we are concerned with is that businesses are not adapting fast enough to the way the new generation handle information to enable the transfer of knowledge within the organisation.

Working for the same employer for decades

Think about it for a while, for how long have the 50’s generation been allowed to learn everything they know? We see it all the time, large groups of employees ready to retire, after spending their whole working lives within the same organisation. They began their careers as teenagers working on the factory floor or in a similar role, step by step growing within the company, together with the company. These employees have tended to carry a deep understanding of how their organisation work and after years of training, they possess a great deal of knowledge and experience. How many companies nowadays are willing to offer the 90’s workers the same kind of journey? Or should they even?

2016 – It’s all about constant accessibility

The world is different today, than 50 years ago. A number of key factors are shaping the change in knowledge-intense professions:

  • Information overload – we produce more and more information. Thanks to the Internet and the World Wide Web, the amount of information available is greater than ever.
  • Education has changed. Employees of the 50’s grew up during a time when education was about learning facts by rote. The schools of today focus more on teaching how to learn through experience, to find information and how to assess its reliability.
  • Ownership is less important. We used to think it was important to own music albums, have them in our collection for display. Nowadays it’s all about accessibility, to be able to stream Spotify, Netflix or an online game or e-book on demand. Similarly we can see the increasing trend of leasing cars over owning them. Younger generations take these services and the accessibility they offer for granted and they treat information the same way, of course. Why wouldn’t they? It is no longer a competitive advantage to know something by heart, since that information is soon outdated. A smarter approach of course is to be able to access the latest information. Knowing how to search for information – when you need it.

Factors supporting the need for organising the free flow of the right information:

  • Employees don’t stay as long as they used to in the same workplace anymore, which for example, requires a more efficient on boarding process. It’s no longer feasible to invest the same amount of time and effort on training one individual since he/she might be changing workplace soon enough anyway.
  • It is much debated whether it is possible to transfer knowledge or not. Current information on the other hand is relatively easy to make available to others.
  • Access to information does not automatically mean that the quality of information is high and the benefits great.

Organisations lack the right tools

Knowing a lot of facts and knowledge about a gradually evolving industry was once a competitive advantage. Companies and organisations have naturally built their entire IT infrastructure around this way of working. A lot of IT applications used today were built for a previous generation with another way of working and thinking. Today most challenges involve knowing where and how to find information. This is something we experience in our daily work with clients. Organisations more or less lack the necessary tools to support the needs of the newer generation in their daily work.

To summarize the challenge: organisations need to be able to supply their new workforce with the right tools to constantly find (and also manipulate) the latest and best information required for them to shine.

Success depends on finding the right information

In order for the new generation to succeed, companies must regularly review how information is handled plus the tools supporting information-heavy work tasks.

New employees need to be able to access the information and knowledge left by retiring employees, while creating and finding new content and information in such a way that information realises its true value as an asset.

Efficiency, automation… And Information Management!

There are several ways of improving efficiency, the first step is often to investigate if parts, or perhaps the entire creating and finding process can be automated. Secondly, attack the information challenges.

When we get a grip of the information we are to handle, it’s time to look into the supporting IT systems. How are employees supposed to find what they are looking for? How do they want to?

We have gotten used to find answers by searching online. This is in the DNA of the 90’s employee. By investing in a great search platform and developing processes to ensure high information quality within the organisation, we are certain the organisation will not only manage the generational renewal but excel in continuously developing new information centric services.

Written by: Maria “Ia” Björk & Joar Svensson

A Health Care Information Commons Vision: from frozen assets to liquid gold

This is the second post in a series (1), unpacking interoperability in the healthcare system. The basis in this post is semantic and technical interoperability, hence a systemic overview.

The future of health care relies on the improved flow of captured patient health information across the whole care continuum. This means a shared information system linking systems and devices from participating health care organisations while maintaining patient privacy and security standards. Such a realization would not only enhance the clinician and patient experience but also enable faster treatment and better care coordination for patients.

Information Commons is an information system, …, that exists to produce, conserve, and preserve information for current and future generations.

 A seamless and secure hub, heavily-linked, providing point-of-care access to critical patient data and care decision support information for the delivery of timely care, reducing the duplication of tests and procedures.

All in all, this has to be built upon a participatory community paradigm, where clinicians, policy makers and leaders, and patients share a vision to create an interoperable information space – that is sustainable, regardless of previous lock-in mechanisms set by different technical, and semantic standards, vendors and process and policy making.

Healthcare Information Commons

How do we create a interoperability climate?

 Changes for interoperability lie in the development of new pilots with strong collaboration. They are generally more successful where they are based on patient or illness groups, value-orientated, open and scalable. Post requirements phase, iteration based on early adopters’ feedback can identify the need for improvements and enhancements around the relevancy, format and visual display of data and information, the usability of the solution and provide insight into workflow impact. The Information Commons is also a good arena for clinicians to share positive anecdotes from their experiences upon which scalable pilots can be expanded.

Such developed infrastructure and services can also support or be leveraged by other national or regional health initiatives.

Technical Layers of interoperability

Interoperability can cover many layers but at its basis would be an interoperable access layer that integrates and securely shares clinical data from multiple sources giving one point of access. The user interface (GUI) could then provide and display data and information based on stakeholder users and medical/situational context.

Such a layer would have to accommodate and support various data from the distributed system of actors, aligning both to open standards while at the same time being plastic enough in design and instantiation.

Interoperability not only covers the sharing of information but also its usage. This may include added functionality by the EHR vendor themselves or the creation of further value-adding knowledge layers that can take advantage of both structured and (the untapped wealth of) unstructured data within EHRs.

Findwise in its EU funded KConnect project is doing just that. It is currently collecting use case studies from Jönköping (RJI/Qulturum) in order to create a pilot solution for clinicians to take advantage of ‘hidden’ textual data.

Questions of interoperability also lie in the physical user experience of the systems themselves. Should the basic layer provided by EHR vendors be open to include value-added software from other parties, should it be embedded or be made into another GUI? Which ultimately is best for the clinician workflow and the agility of software solutions in supporting new value-based outcomes and reiteration for improvements in efficiency and effectiveness?

Semantic Transformer

The annotations made in the healthcare systems across different domains, all have very similar outset, but lack coherent interoperable mechanism to work smoothly outside the local context. On a international, and national and regional level there should be services that acts as the electric grid to provide society with energy to be used in many contexts. A semantic grid that host controlled vocabularies within the domain, but also share practices and processes. With the use of open standards these could bridge across organisational boundaries and help clean the current messy Healthcare information space.

The healthcare information commons, do not per se have to be one system, but rather an interoperable set of services/systems that share standards to be able to exchange information and data. Very similar to they way Internet and linked data work today –  not restricted by walled gardens. The governance of the commons, should be a matter of public services, with sustainable resources and open governance agenda that can invite participation and engagement. No single actor in the network, be it a large hospital, private caretaker or regional public governing body will be able take care of this single-handedly. It should be a true “commons” undertaking!

The infusion of the Information Commons into everyday healthcare provisioning use cases with semantic transformer applications could be in several modalities: finding and acting upon information or contributing in the local context.

In the data entry or capture point, there will be options to add semantic layers and attributes to the type of content and data provisioned. An easy way to illustrate this, is the emerging use of schema.org templated entities and properties for the MedicalTypes, MedicalConditions, Drugs, Guidelines, Codes from controlled vocabularies like SnoMedCT, Mesh, ICD10 and the like.

 Analogously using digital cameras from smartphones or other devices, means that the user might add “some” metadata or tags about the picture. Devices and sensors add more layers of granularity with attributes that most end-users, never see or bother about. These extra resource descriptions, will interplay with cloud based services as Google Photos – where different algorithms reformat, package the content into new forms, as contextual albums, scenes and so forth.

 A set of semantic transformer application layers should be intertwingled with the Healthcare Information Commons. Firstly to make easy linkages between data sets – as the Web of Data scenarios and Linked Data propose –  but also to  provide smarter integration points in back-end supporting processes in the Healthcare systems where more private and locked-in data-sets exist about the patient conditions, treatments and drugs etc.

 The semantic transformer applications could both be open api:s developed by the community for the commons, but also could be commercial applications provided by line-of-business specialist software vendors. As long as all of these layers, are compliant with the open standards!

For such legacy systems as EHR , and off-the-shelf healthcare applications and business applications that are semantically impaired, these semantic transformer applications could work as a repair-kit for already old broken systems. Consequently there would be no need to overhaul all legacy software within the caretaker’s organisation. A kind of smoother migration path to interoperability.

There also exists the need for semantic interoperability between the contextual patient information within the EHR and the provision of clinical decision support information. This could be in the form of internal medical guidelines and best practices, or from external resources such as medical journals or clinical trial reports.

The KConnect project are providing semantic annotation and semantic search services in different languages for clinicians and researchers to access the very latest in medical literature. This is achievable by semantically annotating required medical information (EHRs, guidelines, journals etc) and having the semantic search engine take full advantage of known key medical entities/concepts and their relationships.

Through the indexing of new information about drug usage, best practices, guidelines, new clinical trials and journals, clinicians then access up-to-date relevant information whenever they need.

In the near future to maximise both clinician and patient user engagement with EHRs, different uses and views of the EHR will have to be driven by suitable context and stakeholder semantics.

Shared Decision making

When moving into valued-based health care and outcome measurement, (as presented here by Sveus), it is critical that all actors participate on a connected level field, so that communication between healthcare practitioners and patients and their social networks works.  This includes the need for shared norms and definitions as well as systems to support the decision making – and obviously a harmonised set of metrics to measure outcomes.

As presented by Peter Ubel, in his talks and recent book on Critical Decisions, it is key that we are able to share a common view between the clinician and the patient. All practitioners share jargon that do not always communicate well to the receiver. Hence there are plenty of communication breakdowns recorded in the everyday practices, leading to “malpractice” in the worst cases for the patient. In the last couple of decades, there has been a shift in power relations between healthcare professionals and patients and their families. Patient empowerment is a good thing, but if things get lost in translation, there is the risk that critical decisions are not fully supported.

With a Healthcare Information Commons pool of resources, there lays opportunities to guide patients and practitioners in their critical decision making. But also to strengthen the learning and innovation within the communities of practice, with open feedback loops to the pool.

Privacy & Security upfront

Just as data interoperability can be seen as the sharing of data, data security can be seen as the sharing of data in the right way and data privacy seen as the sharing of data with the right person in the right way. We are naturally concerned as to who may be using our data and want to be able to control its use.

The boundary between citizens’ App data and their medical data is blurring rapidly as App developments and sensors continue to provide new and different data that the individual, health care and clinical research can capitalise on in the effort to move towards better wellbeing and more value-based healthcare.

While data privacy and security have become the headline darlings of the media, they can often be distractors of innovation, often masking the true benefits of the flow of information. Just as with physical assets there are best practices for data misuse prevention, protection and policing. The majority of misuse or abuse of personal data is more often caused by human error and misjudgement than by the failure of technology.

Data interoperability can be better supported when services have clear guidelines to inform citizens as to who, when and how their data is shared, for what purpose and the available steps to alter said process. A better informed public would then see more free data resources being used for clinical research e.g. the Million Hearts initiative in the US where citizen data is being used to lower heart attacks and strokes.

Open regulations, collaboration and co-ordination along with risk assessment and protection practices such as encryption, anonymisation and de-identification, all can go a long way to allowing secure data interoperability, be it personal or aggregated data. IT has the potential too of rule-based access and forensic data access reports. No system can be made fool-proof, however precautions and the presence of well-designed data breach response plan are achievable.

Obviously we do not want all our healthcare records to be open in the air for anybody to use or read, as little as we want our financial records to be in the open. Privacy is really key! The means with the Information Commons should work with aggregated data. Not the singular set of records for one patient.

Patient security derives the need to a more free flow of data between actor systems. The medical conditions and contexts sets the standards for sharing, where extracts or segments should be possible to share aligned with privacy policies.

Future real-life experience exposé

Having a recent Swedish report on diabetes care and outcome measurement in mind. It makes sense, to illustrate the case of a diabetes patient living and acting in Göteborg, West of Sweden. They have a medical condition, being a lifelong journey with an endocrine system out of order. This has a great impact on the patient’s everyday life, and diabetes related complications. With good life balance to training, exercise and eating habits, it is possible to keep the glucose patterns in such a way that your life expectancy will equal to anybody else.

The use of personal choices to trigger improved behavior, gives the person options to chose selected wellbeing (e.g. Weight Watchers), fitness (e.g. Runkeeper) and health monitoring applications. In most cases these are closed down ecosystems, e.g. iOS included Health app, with options to share in social-media (about your progress, in terms of eating well, or improve your personal training). Many Life Science corporations are developing medical condition / disease area / treatment specific Health monitoring applications (e.g. FreeStyle Libre from Abbot for improving Glucose Monitoring) that clinicians recommend during patient consultations.

For clinical researchers there are ecosystem specific toolkits, like the open-sourced Apple Research Kit.  The existence of a closed ecosystem naturally makes it more problematic to share and exchange data. In this space a Open Standards based on the idea Information Commons makes sense too – where semantic translators could improve the transmission of data from one closed ecosystem to another, without privacy infringement.

A Personal Health Record (PHR) , is a health record where health data and information related to the care of a patient is maintained by the patient

In a future more seamlessly interoperable world, the citizen / patient should be provided one-secure-access point to his/hers health account, e.g. in Sweden 1177 and Mina Vårdkontakter and Hälsa för mig.

The outstanding question: How to get interoperability between PHR and Wellbeing, Fitness and Health apps where it is easy to share vital data bits in a sound manner?

In this scene, open standards should be applied to create a make-do semantic transformation.

Lastly – interoperability within the Professional Clinician Workplace?

The statements and real-life stories from the trenches in any clinical workplace, show a mess of supporting information systems. EHRs that by no means either cooperate or interoperate. Many clinicians realise that they have to do data provision into a handful of systems with significant double manual workload. This comes with risks, given the stressful environment, and many “malpractice” incidents can arise from this workplace disorder.

Each system support its part of the process. While some software suites try to close-down into one-system to ‘rule them all paradigm,’ they still barely lean upon any open standards and they lack semantic and structured ways for the use of data and information outside of the supporting system’s narrow scope.

 A diabetes nurse (post patient consultation) has to enter data into more than 10 different areas, including quality assurance and measurement systems e.g. NDR in Sweden. In some cases there have been integrated point-to-point solutions put in place, but mostly this is not the case and so unnecessary frustration is created.

In every intervention where clinicians and patients communicate, regardless of it being online, remote, on-site, there should be opportunities to tap into the Healthcare Information Commons space. With the potential to find recent new medical treatments, emerging standards/guidelines, breaking news for clinicians as well as patient-oriented and formatted communications. In the best of worlds, semantic translator applications will bridge between ecosystems inside the personal health space as well as into the workplace environment for clinicians – helping, guiding and improving all dimensions of interoperability.

Concluding remarks

Having value-based Healthcare and Outcome Measurement domain as a specific health care change driver, will push the use of standards on all levels to the limit. In the following blog post in this series, the ambition is to unpack information governance, since the data ownership and trust also have to be ironed out. And as stated by Prof Michael E. Porter, the capture of data to do proper Outcome Measurement is one of the major road-blocks ahead. The orchestration of all resources and governance still have to be unfolded. Happily some building blocks to the Healthcare Information Commons have emerged, so we do not need to reinvent the wheel:

  • Wikimedia realm “commons“- with all entries of semantic useful data in wikidata.org
  • Standard Sets for Medical Conditions by international collaboration at ICHOM, and in Sweden Sveus. Standards from Hl7 FHIR, W3C and Web of Data / Semantic Web. The Swedish National Board of Health and Welfare, have an embroic information structure (not in semantic machine readible, RDF, format). Information intermediaries like Google have settle for simple schemas for health and medicin.
  • Open Innovation, and the “open” paradigm, will change evidence based medicine, Bad Pharma and Science on a sociatal level, as stated by Ben Goldacre (TED) where we as patient together with clinicians are able to question treatments based on open data, and improve quality to Healthcare Information Commons.
  • The technology stack with smarter devices, sensors and things, along with Internet anywhere with cognitive computing and computational knowledge on-top of the commons will bring forward semantic translators.
  • New leaps in collaborative work and development with the use of the notebook theme, language and platform agnostic ways.

Making sense, defrosting health data into liguid gold improving healthcare for all.

For more information on Findwise research, please visit KConnect and Orios (Open Standards)


View Fredric Landqvist's LinkedIn profileFredric Landqvist research blog
View Peter Voisey's LinkedIn profilePeter Voisey